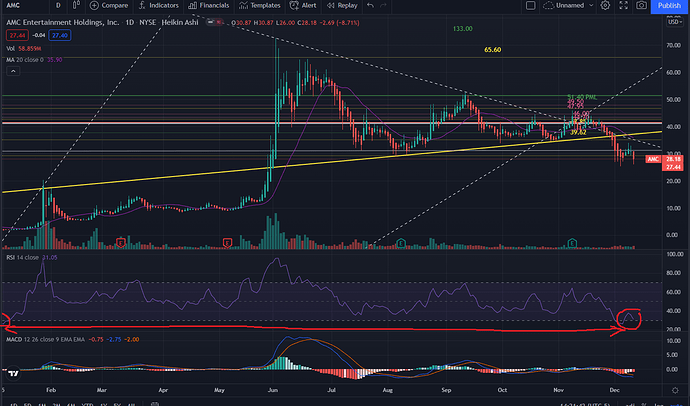
The last time the RSI on the daily AMC chart was below 30 was on January 6, 2021. Over the next 21 days, the stock price ran up from $2.01 to $20.36. The RSI dipped below 30 on December 1 and closed at 33 on December 10. I wonder if a similar upward move is likely over the next 1-2 months? I’m not saying a 10x move but at least a larger bullish move over the course of several weeks. This is obviously dependent on no more bad macro news, though as this stock price has clearly been highly correlated with negative news events over the last several weeks such as Omicron, the Fed’s comment on “transitory inflation”, November 2021 jobs report, and November 2021 inflation data. Trading algorithms are likely reading in this type of news off of Google or wherever and triggering sell cycles, but it’s possible other algorithms will pick up on the substantial drop and TPL of the Daily RSI and trigger massive buy cycles. Thoughts?
If you look at the price action, nothing really makes sense, specially since the last 2 weeks.
I mean we saw that the price action was very weird since the last months but what we are seeing since let’s say a good week is akward.
You should look at the RSI on a year-to-date basis and you’ll see that we are on the same spot we were at beginning of January.
Nothing makes sense. What we need is a serious volume.
We should use a very pragmatic approach. I don’t know if a stock benefited from such a buying pressure over a full year in the stock market industry. The buying pressure on $AMC was crazy high.
And look at $DWAC for example. This stock had huge buying pressure for 2-3 days and the price skyrocketed.
For $AMC the stock benefited from huge pressure over the last 12 months (not everyday for sure).
There’s no volume because most of the Apes spent all their money on shares already… at least that’s my situation. I could’ve had about 1000 more shares, but lost that $$ on options due to the FACT that Jim said August ATH would happen… then Sept… then Oct… then Nov… totally scammed.

