Astro's Live Stream Notes

If you missed yesterday’s action, Astro had a guy on who was able to predict the direction of price move based on patterns he saw in the bid/ask. Specifically, when prices ended in certain numbers it was a trigger for the algo to go up/down and possibly dump in dark pools.

I’m compiling some of the highlights embedded within the “Losing Faith” thread, astro’s stream and a “legend” of sort that breaks down the possible algo instructions in the event those with a few more wrinkles can make use of it.

Astro’s stream (cued up at keith’s arrival)


image

Market maker thing went out after January run up and was debunked.

Keith is using an entirely different set of codes. Copy/paste from his notes:

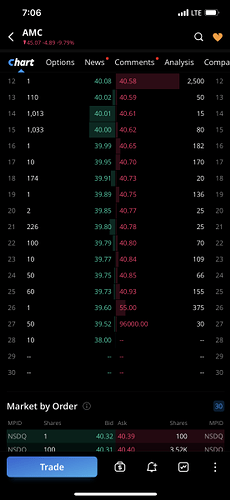
I’ll start out by what I called brackets. Take a look on the very top bid side.
At 40.08 there is a 1 share bid. Look down to 39.99 you see another 1 share bid. That’s the bracket
All the orders inside of that bracket will be hit by the price movement
The one is the code for the algorithm.
The numbers have a priority set to them.

Let’s find the other brackets and then we will go over the priority of each code
At 39.99 you still have the bid of 1 share so go down and we have 39.89 also a bracket of 1 . The number 1 is the highest priority from the market maker. You will see bids of 101, 111, 311, etc. You’re looking for the last.
The last # is the algorithms code.

So real quick look at the ask side to see which asks are inside of a bracket.
I’m sure every sees all the orders ending in 5
At 40.61 you have 15 shares. So we go down until we find the next ask ending in a 5. Which is 40.77 of 25 shares.
The other orders inside that bracket of 5s has a priority set to them.

They use just about every #0-9 as a code.
So to be clear a bracket could end in any number 1-9. I’ll explain the 0 by itself
Bids in a bracket priority. This is where buying and selling pressure comes from.

1= highest priority. Meaning as far as orders ending in it has greater pull to the side its on than the other numbers 2-9 that are also in brackets.
5= is the next priority with a very high pull to whatever side it has a bracket on
8 = is also a higher priority than 2,3,4,6,7,9

Here’s why you have only 1, 5, and 8 that has a higher priority than the other numbers.
222 is a code all by itself. Honestly don’t know exactly why it’s set apart but when you see it all by itself and no brackets on that side of the bid or ask. The price will always pull towards that 222 order
I have noticed that once it starts pulling the price to whatever side it’s on, eventually a bracket will form before the price reaches the 222.
4= not 100% sure but it stands alone most of the time ( not in a bracket). It has minor pull weight to it.
6= The easiest one. No bracket for it. This is your choppy pattern number. When the price movement runs sideways several orders ending in 6s will pop up right at the top on both sides. Bid and ask.

Here’s where the 0 comes into play. Once the market maker is finished trading sideways ( institutions loading thier boats) ( or unloading thier boats) you will see a bracket of only 10 shares. Inside that bracket of 10s is normally a larger order and it is 100% the price will shoot to the price inside those 10s. It could take an hour but it is 100% it will go to that price inside the 10s. The only exception to any of these brackets is if one of the numbers change all of a sudden. Most of the time it will flip again to the same bracket but I consider it the same as I would a broken pattern.

So we have the 7 and 9 left. I’m not 100 % positive but pretty sure the 7. acts as a stop and also send orders to the darkpool. The 9 is to bring it back from the dark pool. And I know that just blew your top off. Lol.

So that is the basics and pretty much the whole process of order flow, volume surges, buying pressure and selling pressure. I will next break it down a little more condensed. But you must know, understand, and remember what 0 through 9 mean.

Simplified. Start out watching for the bids and asks on each side of the order flow ending in a 6. 126 has higher pull up or down than 226 or 326 etc. This is the choppy pattern where stock only raises and drops around .10 cents per say. It shows a next move coming when a bracket forms on either side. Look down both sides of the whole order flow and see if you see anything in brackets of 5s or 10s. Remember on the 10s that it will go to that price. If it’s way down on the list it usually goes there at some point in the day if those numbers remain. You will see the 6s pop up again. Then the the price will head in that direction.

6 Likes

Thank you for this !!!

1 Like

badass!

perhaps this can be a complement to to everything else in our toolbox.

1 Like

Yes! Thank you @denny.webdev for actually doing the DD so you can set the record straight. Some people around here like to cut and paste and not actually read or learn or listen.

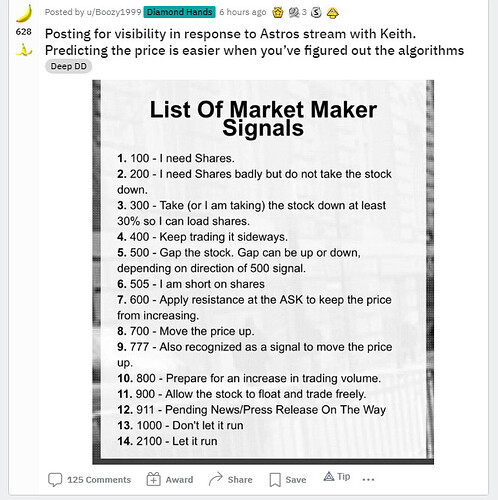
That list of market maker signals (above) is from 2004 and has nothing at all to do with anything Keith talked about and should be deleted immediately.

The key according to Keith is the ENDING digit of order, not the first digit. So you can throw the 100, 200 ■■■■ out the window.

2 Likes

might want to let reddit know. they’re carrying on as if this is still playing out

Reddit is like 4 people doing DD, 10 million people posting memes and 500 million people reposting those memes.

One day someone will make a meme that explains to reddit exactly what 500 million redditors are doing wrong.

Its not today. And it’s not me.

3 Likes

i won’t disagree with you there. DD is done. Now, we seem to be in the meme phase.

I watched it and Holy ■■■■!!! Amazing! I look forward to next week observing his wizardry!!! Astro!!! Combined group effort with Albro’s and this wizard! Astro is sending him a computer.

haha i know. i was surprised astro went with the ipad but hey, get that man some tech.

Thinking about writing a program to help manage this. What would be the best API to get market data?

Another DD in Reddit : https://www.reddit.com/r/amcstock/comments/phhe54/keith_the_cyborg_ape_encrypted_signals_on_level_2/?utm_source=share&utm_medium=ios_app&utm_name=iossmf

The question is how can we use this on the longer term to our advantage.

When I was watching the live stream the price was moving to those brackets in a few minutes at most. Sure we can see a rough direction on the short term but I don’t see that giving us much advantage. We would need to know the larger move on the day unless we could find a smaller pattern that always played out on an up or down day.

I see Astros pattern that he found to be far more useful to us as we could see where we are in the trend and also know what’s coming for the next week or so.

I have not watched the video yet. But I am having a hard time understanding how this would work at all, considering the NYSE order book is made up of so many market participants who can place an order for any number of shares they desire.

Astro live streaming right now while they try to figure more out. He welcomes others on his stream to collaborate.

From what I’ve read in the chat is that people are championing both sept 9th and Sept 23rd as the run up

1 Like

and the saga continues… watching now.

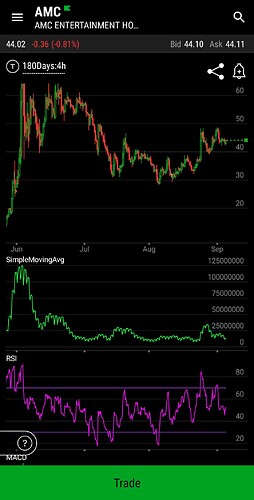
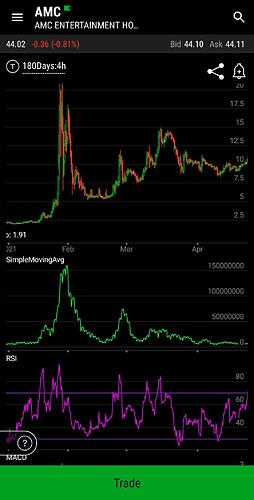
Somebody tell him to set the volume to a sma at 14 and compare with the RSI…

I do t follow him

Can you expand on this comment?

June run

Jan run

Price is top

Volume green. The pattern of volume is mimicking the RSI

Volume declines as the overall RSI declines and lifts when the RSI lifts.

The RSI is choppy and when smoothing it, it becomes less accurate. Comparing can help show the turning point high and lows. Since it’s a line, it can take shape vs a bar chart. The day to day volume swings are less volatile than actual price.

If you set a horizontal line from bottom to bottom you will see the approach to turning points.

RSI have lift and decline, and you have to see them to know where the turning point is. Volume is leanr

2 Likes

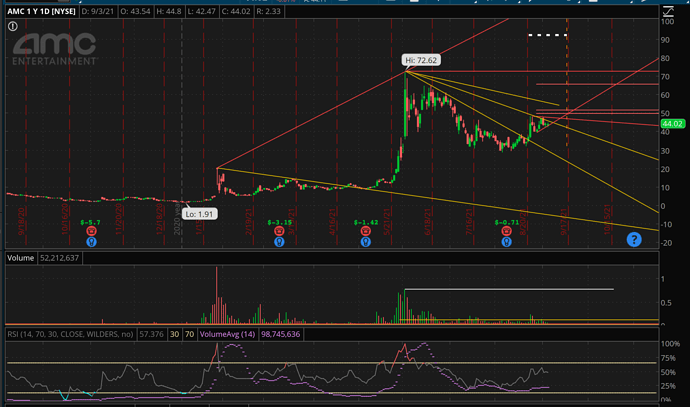
I’m playing around with this on ToS… If you swap to the daily chart, it’s pretty interesting to see how the RSI going overbought* at the same time that the VolAvg starts to create gaps, it telegraphs the breakout while still giving you time to enter.

1 Like

BAM Investor is not a licensed broker, broker-dealer, market maker, investment banker, investment advisor, analyst or underwriter. Our discussions, analysis and predictions are derived by our interpretation of our proprietary model’s readings, and should not be misconstrued as an investment recommendation or advice in any form. It should be clearly understood by anyone viewing this site or related materials that investing in the stock market carries with it inherent risks and uncertainties. The actual results of a stock or commodity or currency could differ materially from descriptions given. There is a risk for substantial losses trading securities and commodities. Material and commentary provided is for information purposes only and should not be construed as an offer or solicitation of an offer to buy or sell any securities.

The information contained on this website and any subsequent reports or articles are based on analysis of qualitative, statistical, and financial data and should not be interpreted as recommendations based on a complete investment evaluation. The information is based on sources that BAMinvestor believes to be reliable, but no representation, express or implied, is made with respect to the accuracy, completeness, reliability, or timeliness. The information is subject to change without notice, and BAMinvestor does not accept responsibility to update it.

BAMinvestor does not accept responsibility or liability for any direct, indirect, special, consequential, or other losses or damages of any kind whatsoever arising out of access to, or use of, any reports or information contained in it.

Principals or employees of BAMinvestor may have a position in, and may from time to time purchase or sell, securities of any company discussed in this report.