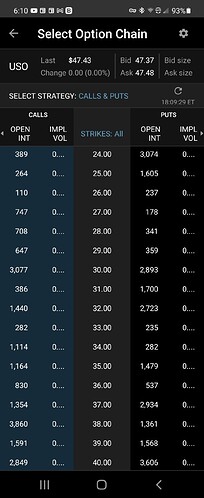
Trying to eyeball the USO chart to get an estimate of where to buy puts that roughly correspond to CL predictions but not having much luck. How do I work this out?
THIS!
Same with GLD. They aren’t 1:1 like their futures equivalents. I also would like some figures @jgsavoldi if a conversion, of s(h)orts, exists
The method I have been using is to go back on the USO chart and look at where retest levels were created specifically on that chart. Generally this lines up pretty well with the CL futures market, but if the retest was created like Sunday evening or something in the futures market this can get a little wonky for USO.
A simpler, but maybe less accurate (we’ll see when we get there) strategy would be to look at key points when both USO/CL are open for trading and calculate a ratio between the prices. This has issues because the markets are somewhat different but if you average across a handful of key price points it should give you a reasonable ballpark price, at least for the very near term.
My USO chart of the trendlines (and speed lines?) looks quite a bit different than CL so the next few weeks should be a good experiment.
I have been using a .30 deviation. 68.03x.30=20.409. Take $68.03-20.49=47.621. That is a close as I have been able to narrow it down to. Sold a chunk of mine July 19th, but we be getting somore for JAN 2022. Using this method gets me to the 24 Strike and BAM is predicted 35.25 retest. A ton of put at strike $24 Jan 2022 already! Hopefully that help but my USO profits have been one of my best in the commodities. Not financial advice and not a finacial advisor… U know the spiel. Lol good luck!
nice, man! thanks for the info. Will def pick up a few with you.
Have not tested it for GLD as I got out of my position a little bit ago when things went sideways. Still have a small position waiting on a bounce.
SCO, is a 2× oil short…might consider this , I have had some luck with calls on this etf…gl all
DRIP is a short ETF too

